
Message Sends
Aampe offers multiple ways of tracking message sends, each with their own advantage.
Week In Progress widget
The "Week In Progress" widget is a quick view of the current week, available from the Home dashboard. It makes it really easy to see how many messages are going out each day and during each time window.
Each day is broken down in to multiple bar graphs, representing each of your message sending windows.
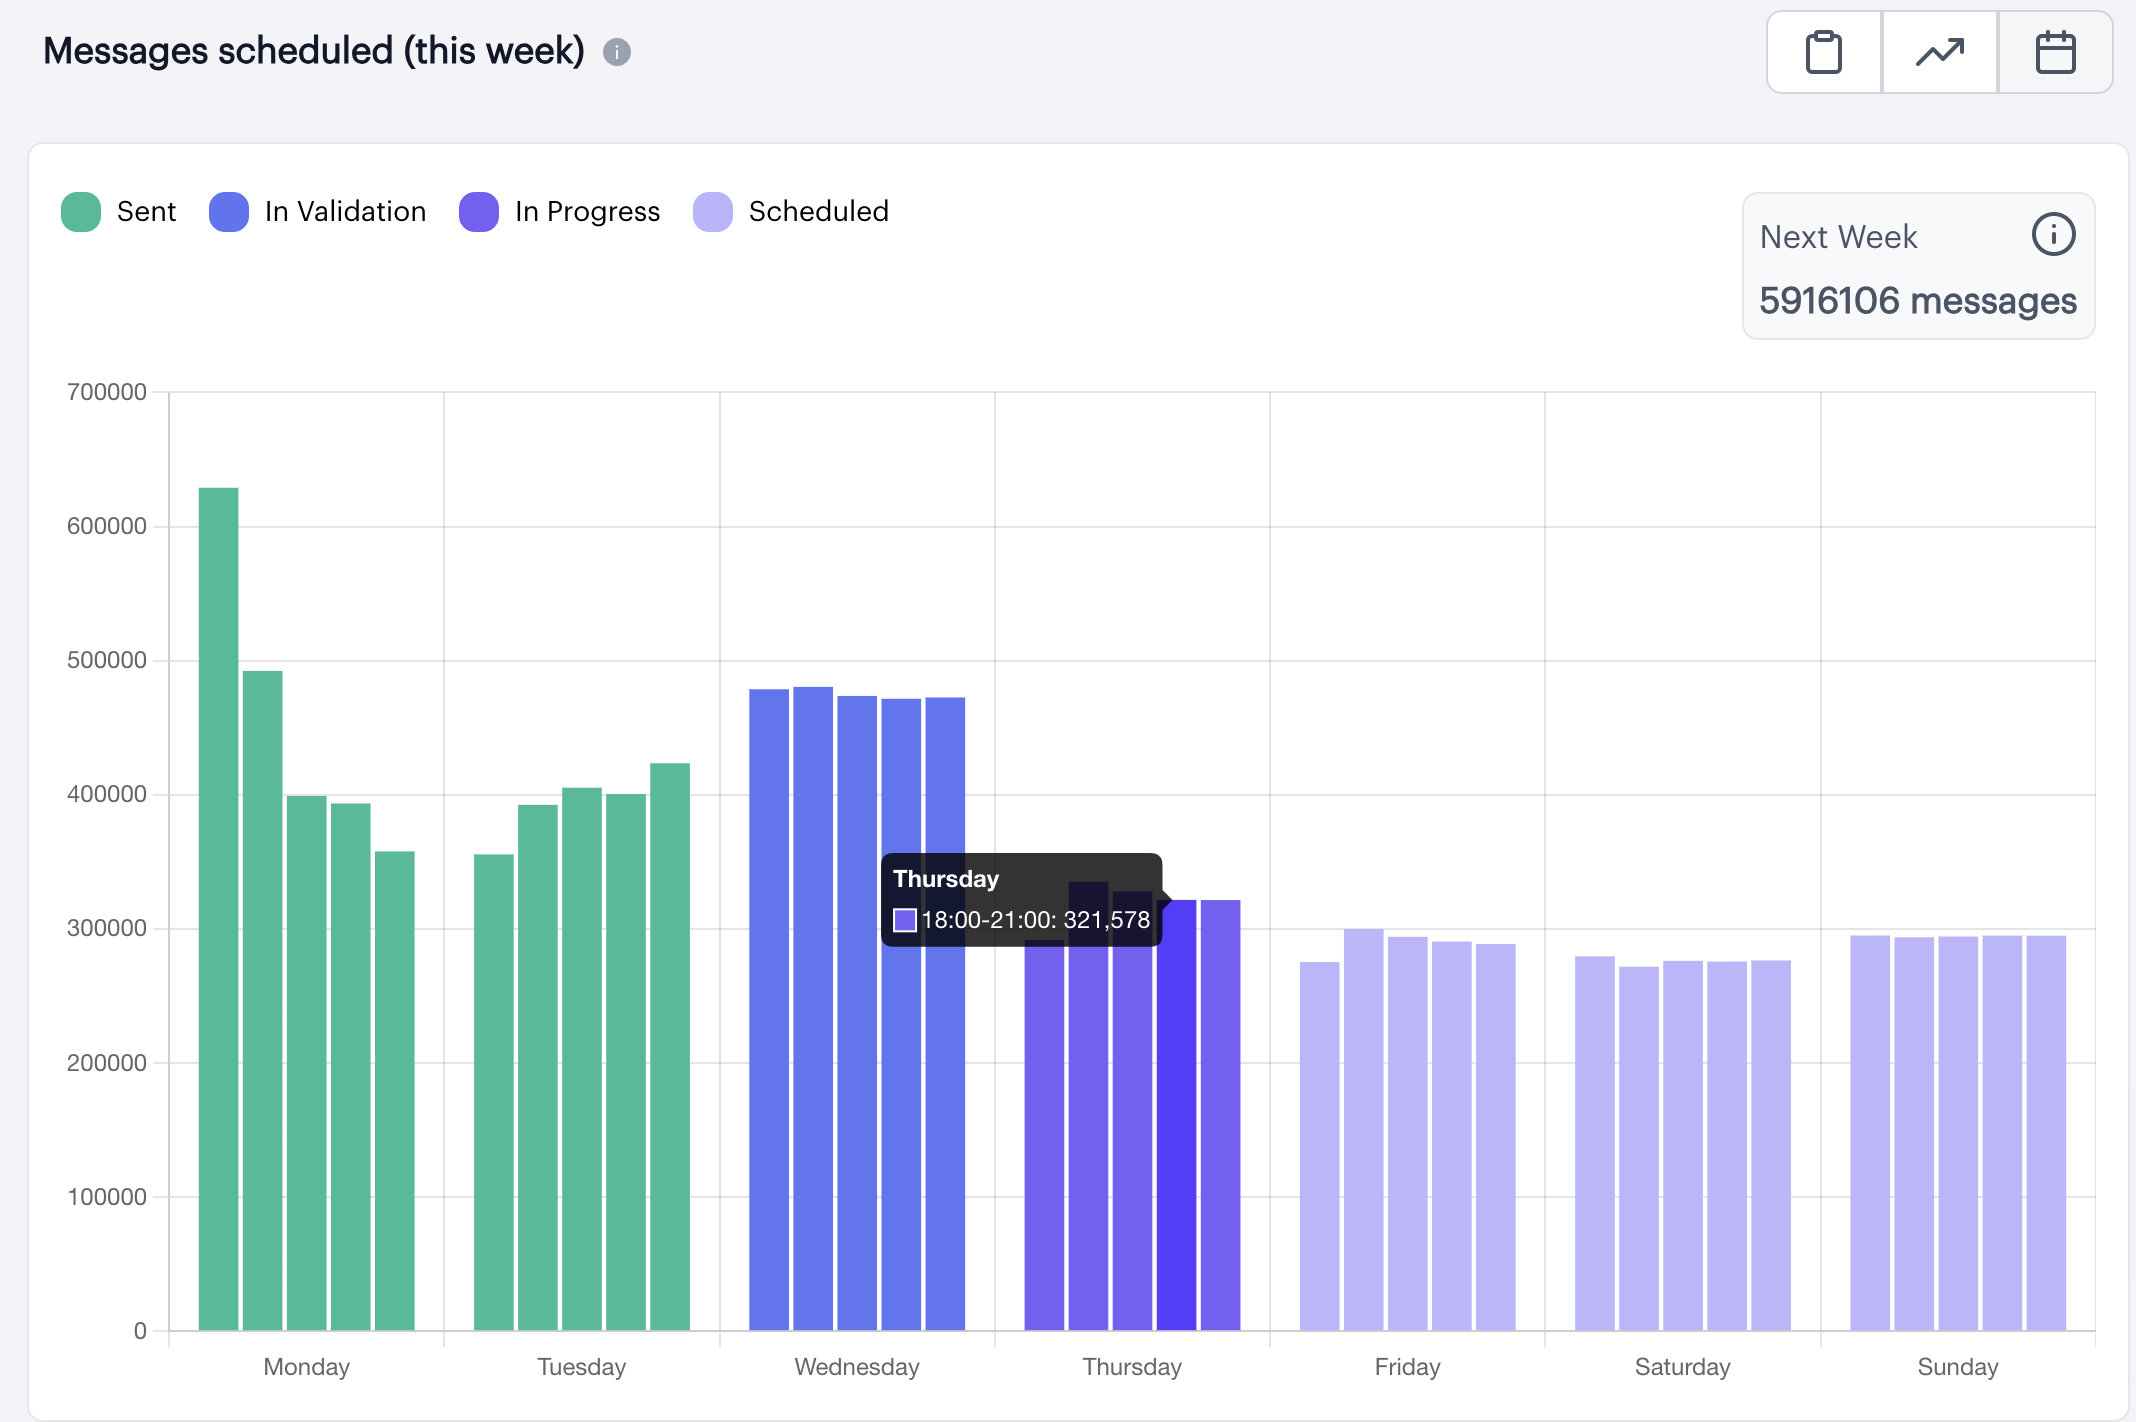
In addition to counts you'll be able to see the status of messaging for each day, including:
- Sent
- In Validation
- In Progress
- Scheduled
What does "In Validation" mean?Aampe schedules a set number of messages each day, but for a variety of reasons (including invalid token_ids) it's not guaranteed that all of those messages will be received.
The validation period allows us to verify message sends and eliminate messages that were not successfully sent.
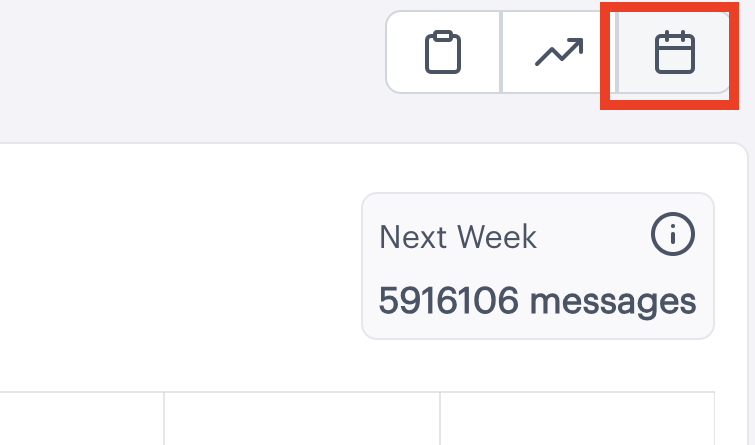
To access this feature, simply visit Aampe's home dashboard and click the calendar icon.
Not seeing your data?Aampe's monitoring metrics are refreshed every 24 hours, at 12pm UTC. If data is not present or looks out of date, check back in a few hours.
Monitoring: Scheduler Heat Map
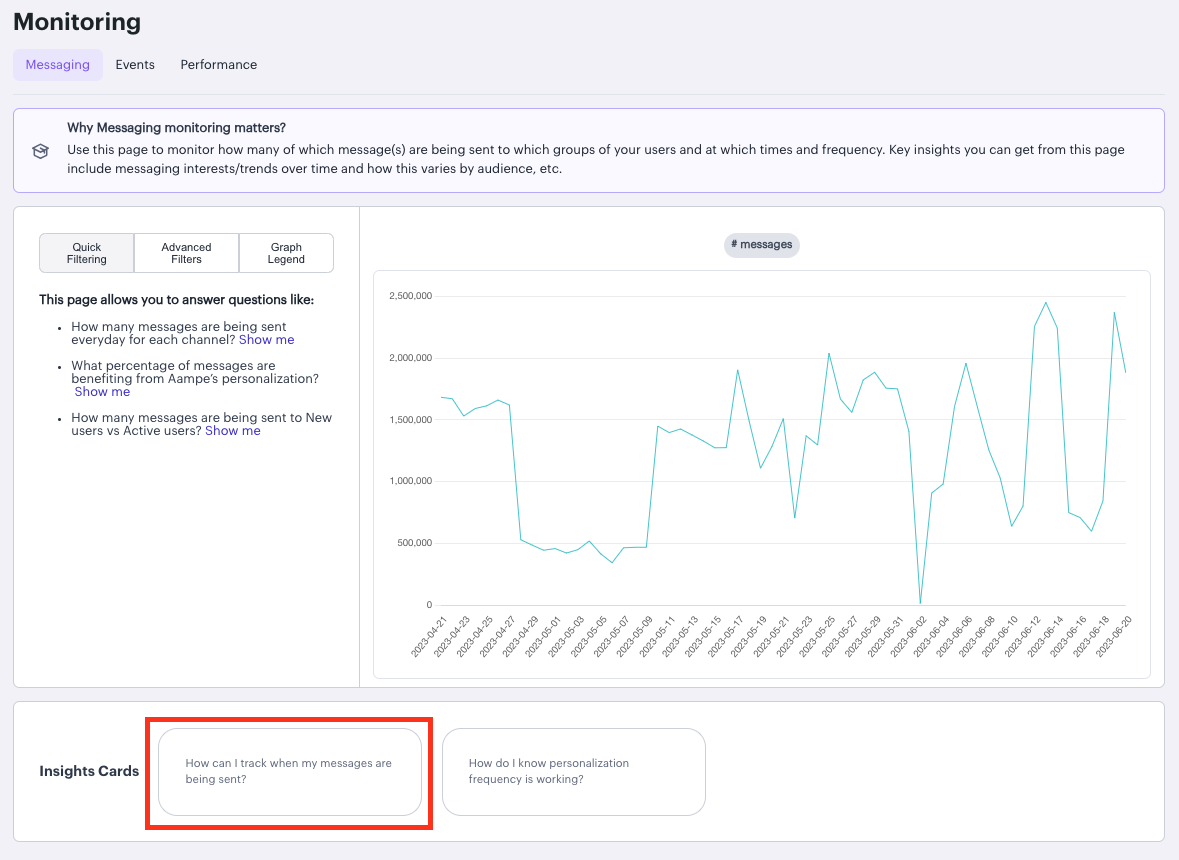
For more detailed insights stretching beyond the current week you should visit Aampe's Monitoring section, specifically the Monitoring > Messaging tab
In the "Insights Cards" section you'll see one option for "How can I track when my messages are being sent"?
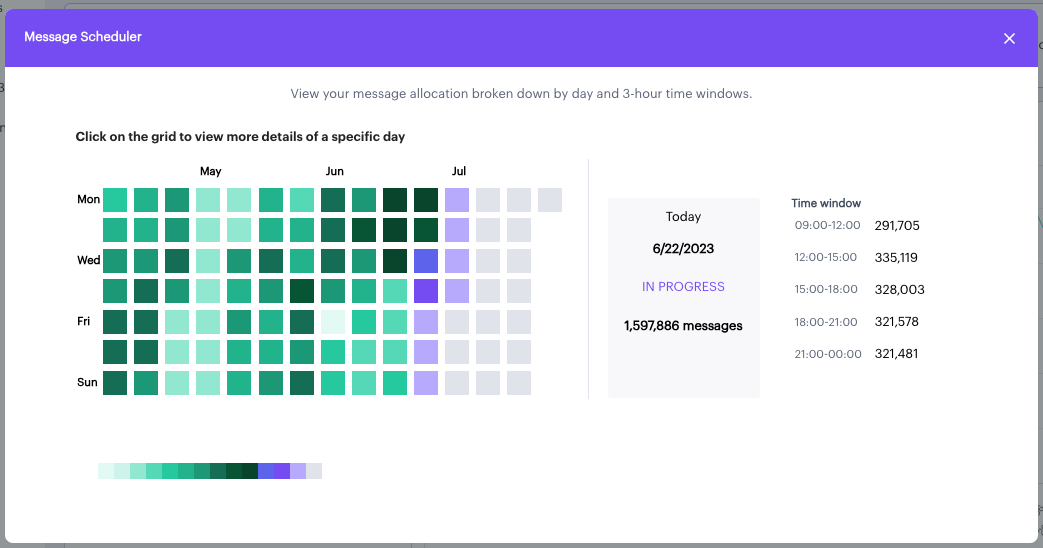
Clicking on that option will bring up a view of the Message Scheduler heat map, which displays message sends going back over the last couple months.
You can click on any given date to explore the number of messages sent that day for each timing window.
Monitoring: Messaging Charts
You can also view message sends over time from Aampe's Monitoring > Messaging tab
Initially you'll see a simple graph of # messages sent over time.
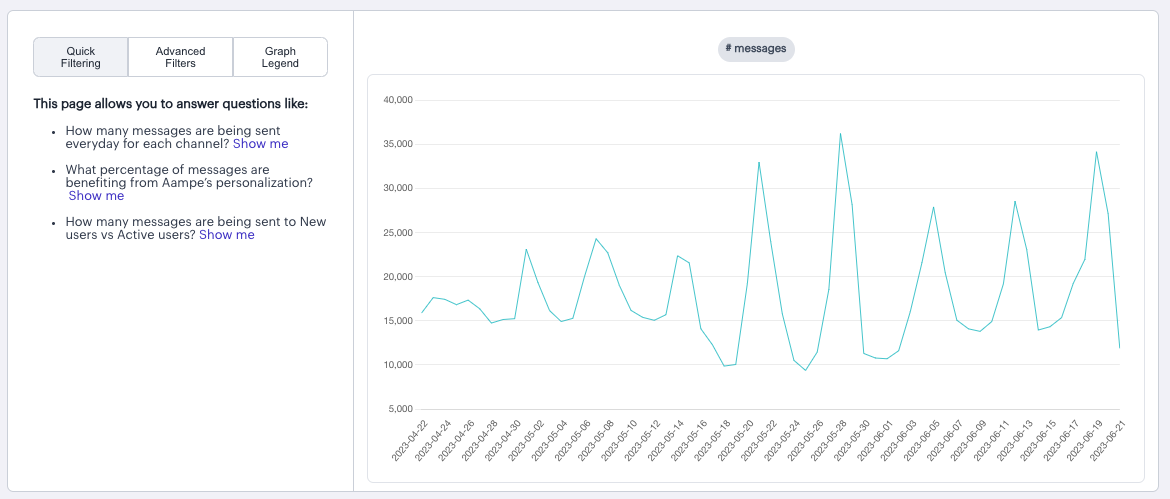
To explore this data in more detail you can either select some of the preset charts under "Quick Filters" or you can click on "Advanced Filters" to apply your own breakdowns and filters.
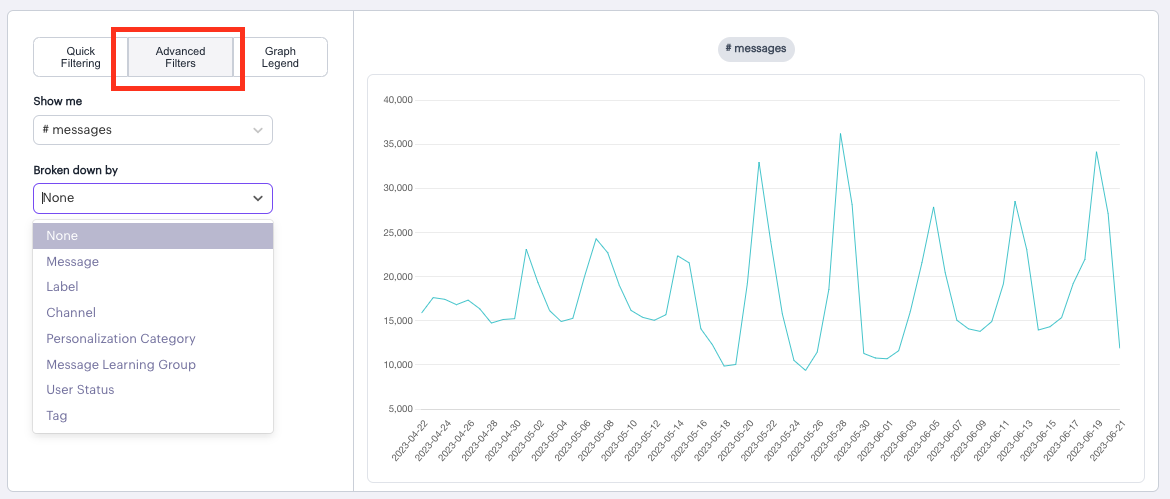
"Breakdowns" allow you to view the data from multiple different angles including:
- Message - number of sends broken down by each of your live messages
- Label - number of sends broken down by your content personalization labels (Offerings, Value Propositions, Incentives)
- Channel - number of sends broken down by messaging channel (Mobile Push, SMS, Whatsapp, etc)
- Personalization Category - number of sends broken down by the level of personalization applied to the message (eg message was personalized for timing, timing and copy, or not personalized at all)
- Message Learning Group - number of sends to users in each Message Learning Group
- User Status - number of sends to users based on their status (New Users, Active Users, Lurking Users, etc)
- Tag - number of sends broken down by any content tags that you've applied to your messages.
Tags are for your internal organization purposesAampe does not use tags for model learning. These tags are available for you organize your messages and view analytics according to internal needs.
For example, if you want to see how many messages you sent that included brand promotions, or were abandoned cart messages, you can apply tags to do that.
Updated about 2 months ago